Release v1.1.5
Published on June 24, 2026
CUSTOMIZED NOTIFICATION SUBSCRIPTIONS
To give users more control over the notifications they receive, we are enhancing the existing Subscribe for Updates experience on our ABB Smart Power Digital Status Page.
We're making it easier to stay informed about what matters most to you.
With this enhancement, you can now tailor your status page subscriptions to match your needs. Whether you want to receive updates for all products and applications or only for the specific services you use, you're in control.
By subscribing only to the notifications that are relevant to you, you can reduce unnecessary alerts and stay focused on the information that matters most. And if your needs change over time, you can always update your subscriptions by adding or removing products and applications at any time.
What's Changing?
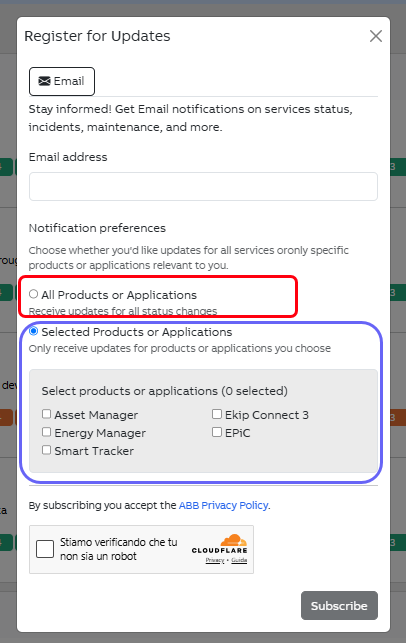
Users can continue to subscribe through email or SMS without creating an account. After verification, they will be able to choose whether they want to receive notifications for:
- All products and applications
- Selected products and applications
If the custom option is selected, users can choose one or more products/applications from the available list.
How It Works
The list of products and applications is dynamically populated from the Status Page backend. Any newly onboarded product or application will automatically become available for subscription.
Users will receive notifications only for the products or applications they have selected, unless they choose the All option.
The Subscribe button becomes active only after a subscription preference has been selected.
Managing Preferences
Subscribers can update their preferences at any time using the new Manage Preferences option, available in:
- The footer of email notifications
- A manage link included in SMS notifications
When users access this option, they are redirected to the Status Page where a modal displays their current subscription settings, including the products and applications they are currently subscribed to.
From this modal, users can:
- Switch between subscribing to all products/applications or selected products/applications
- Add or remove specific products/applications from their selection
- Unsubscribe completely from all notifications
Users can resubscribe at any time if they choose to do so later.
Any changes are applied only after user confirmation, and a success message is displayed once the update has been completed successfully.
Release v1.1.1
Published on Nov. 10, 2025
We have introduced several improvements to make the Status Page clearer, more intuitive, and easier to understand. Below is an overview of the key updates.
- Improved timeline color logic
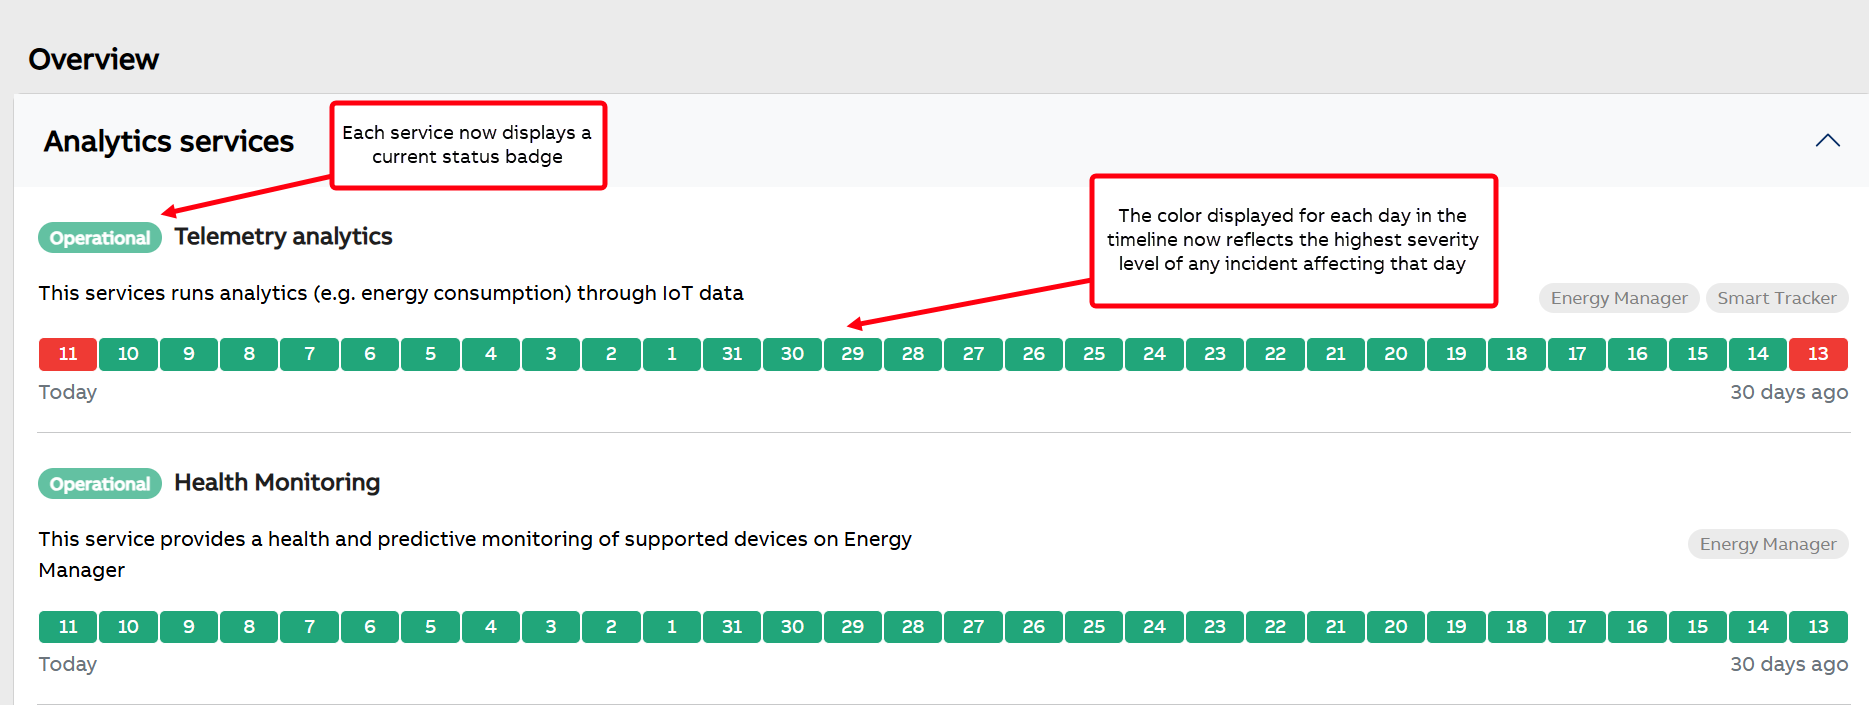
The color displayed for each day in the Overview timeline now reflects the highest severity level of any incident affecting that day. This includes both:
- incidents opened on that day, and
- incidents created earlier but still active on that day.
Color legend:
- Green – Operational
- Yellow – Degraded
- Orange – Partial Outage
- Red – Major Outage
- Blue – Maintenance
This helps you quickly understand the worst service condition experienced on a given date.
2. New “current status” badge for each service
Each service now displays a current status badge (Operational, Degraded, Partial Outage, Major Outage, Maintenance).
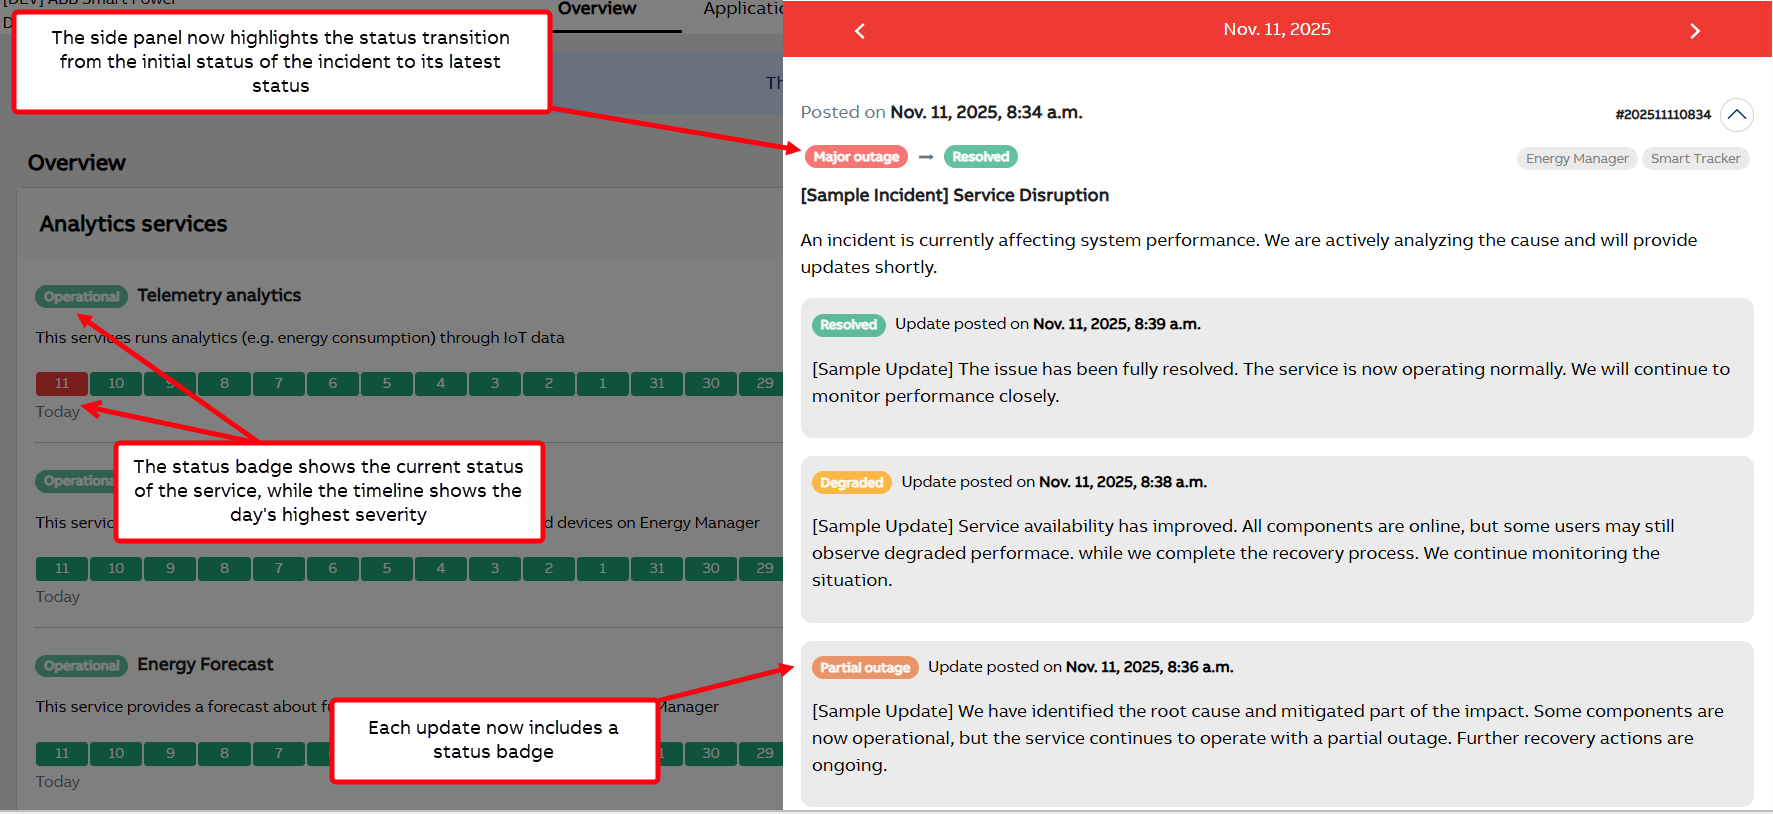
Please note that the current status badge may be different from the color shown in the timeline, because the badge shows the status right now, while the timeline shows the highest severity experienced during that day.
To view what happened during a specific day, simply click on any date in the timeline to open the details side panel.
3. Incident history now shows status badges
Inside the incident side panel and in the Notification page, each update now includes a status badge. This makes it easier to understand the progression of the incident over time.
Additionally, the side panel now highlights the status transition from the initial status of the incident to its latest status, giving you an immediate overview of how the incident evolved.
Welcome to our New Status Page!
Published on Oct. 7, 2025
We’re thrilled to launch our new and improved Status Page, your place to stay informed about our services in real time.
Check what’s running smoothly, see if anything’s under maintenance, and even get instant notifications when something changes.
Simple. Clear. Always up to date.
A fresh, intuitive experience
Our new design makes it easier than ever to understand the status of our services at a glance.
- Color-coded timeline: 30 days of history for each service.
- Clear severity levels: Green for operational, yellow for degraded, orange for partial outage, red for major outage.
- Quick insights: Each service includes tags showing which applications could be affected and a short description for clarity.
Click on any day to see details and updates for that date, all shown in a sleek side panel.
Explore by Application
Looking for something specific?
Use the Applications tab to filter and view only the services that impact your chosen application. No clutter, just the information that matters to you.
Stay notified, stay ahead
Want to stay in the loop?
Subscribe to receive email or SMS alerts whenever there’s an update using the button “Subscribe for updates”.
- Emails give you the full story.
- SMS keeps it short and direct, with a link back to the page.
- You can unsubscribe anytime.
Never miss an update again.
Your go-to resources
In the top-right corner, you’ll also find the Application Library button, access documentation or download info for your applications.
We’re Just Getting Started
This launch is just the beginning.
We’ll keep improving the Status Page with new features and usability updates, all to make your experience better and more transparent.
